In this fourth article in a series of blog posts in the context of the MISTic project concerning the traffic situation in Brussels in times of Covid-19 restrictions we bring an update of the development of the traffic by comparing it with pre-Covid-19 outbreak times.
Our analyses are based on a dataset of Brussels Mobility, which contains vehicle counts on 55 busy locations in the city of Brussels. In our first blog we described that during the first lockdown in March, we discovered traffic had dramatically reduced overall, but less so on the small ring of Brussels, where peaks of up to 80% of retained traffic were observed. In the second blog, we focused on the evolution of traffic during the first wave of relaxations of the restrictions which started in April, and revealed some interesting traffic volume patterns. Our third blog zoomed in on the traffic situation on the small ring of Brussels since the beginning of the restrictions until the beginning of the summer, guided by some elucidating visual analytics.
In this fourth blog, we bring an update of the development of the traffic in Brussels by comparing it with pre-Covid-19 outbreak times. To this end we use the historical vehicle count data available for 17 key locations in Brussels. We observe that the varying restrictions had, and still have, an extensive influence on the Brussels traffic.
Holidays
As one can expect, traffic is heavily influenced by the holiday periods. Students do not have to go to school, parents often take a holiday as well, some leisure activities take a break, while other activities dedicated to holiday leisure arise, etc. This phenomenon makes it hard to understand whether a sudden drop in vehicle counts at the start of a holiday is due to the 'holiday effect' or due to the ever-changing Covid-19 restrictions. To gain more insight, we constructed some weekly fingerprints (as introduced in our first blog) in the figure below.
In the first fingerprint, 'Regular work-school weeks', we illustrate the average traffic volume per hour of each weekday in the city of Brussels. For this we aggregated data from 2018 until the first Belgian lockdown in March 2020, and excluded school and public holidays. Since we use this fingerprint as the baseline for the subsequent analyses, we indicate in its centre that it represents 100% of the traffic volume.
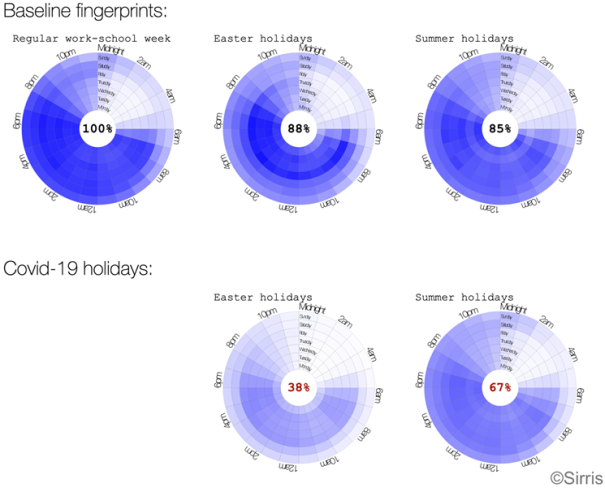
Extended weekends during Easter holidays
Next to the regular work-school week fingerprint on the first row, two similar fingerprints are constructed for the pre-Covid-19 Easter and summer holidays. In the Easter holiday one can, apart from the weekend, observe a decrease of traffic volume mainly in the beginning and at the end of the work week. This might be caused by people taking an extended weekend, in particular around Easter Monday. This phenomenon is not observed during the summer holidays, where the decrease in traffic volume is nicely spread out.
Less summer traffic without imposed restrictions
The second row of the above figure shows the traffic fingerprints for the Easter and summer holidays during the Covid-19 pandemic. Due to the imposed lockdown, we can observe an additional 50% decrease of traffic volume during Easter, compared to the baseline Easter holidays. Some months later, in the summer holidays, all transport restrictions were abolished by the government. But surprisingly, a reduction of still 18% of the traffic volume was encountered. This might be due to several reasons e.g. more teleworking officially encouraged by the government [statbel], less travel-related to leisure activities such as children’s camps and visits to museums and other cultural events, no traffic linked to festivals, etc.
Monthly comparison

Pre-Covid-19 traffic is fluctuating
The Brussels traffic volume is highly seasonal since it is influenced by weather conditions, holidays, yearly events, etc. The blue bars of the bar chart above illustrate this by visualising the average weekly vehicle counts over the available locations for some consecutive months (aggregated since 2018 until the Covid-19 outbreak). We can observe the highest peak of traffic volume in May and the lowest peak in July and August.
October traffic reached almost normal Pre-Covid-19 volumes
The grey bars in this bar chart show the same values, but during the Covid-19 pandemic. This enables us to compare the weekly counts with what we would expect in a Covid-19-free situation. Between each corresponding month, the difference (Δ) in percentage is shown. We can observe that the overall seasonal pattern was somehow retained, while the reduction in traffic volume compared to what we would expect, kept decreasing (expect from a jump of 7% in July). This ended in a decrease of only 5% in traffic volume in October. So, traffic was getting very close to the pre-Covid-19 situation. This also indirectly indicates that the regular economic activities in Brussels were also gradually getting recovered. Unfortunately, not for long before the new restrictions were imposed.
Rush for taking a holiday break in July
As mentioned in the previous section, there is a sudden relapse of the traffic volume recovery in July. In here the difference compared to pre-Covid-19 times increases from 21% to 28%, while before we could only observe a decreasing trend in these percentages. Moreover, this traffic volume drop/valley completely disappeared in August. This might be explained by the fact that, once the restrictions were lifted shortly before the summer holidays, people decided to take their holiday immediately in July.
This article was also published on the EluciDATA Lab website, as part of a series of blogs in the scope the MISTic project executed by the EluciDATA Lab of Sirris with Macq and VUB as partners. The MISTic project is subsidised by the Brussels-Capital Region - Innoviris.


]]>